I'm moving the GS blog to the new site.
Friday, September 19, 2014

Thursday, September 18, 2014

Wednesday, September 17, 2014

Sunday, September 14, 2014


Wednesday, September 10, 2014

Monday, September 8, 2014

Sunday, September 7, 2014

Saturday, September 6, 2014

Thursday, September 4, 2014


Monday, September 1, 2014


Saturday, August 30, 2014

Thursday, August 28, 2014

Wednesday, August 27, 2014

Sunday, August 24, 2014
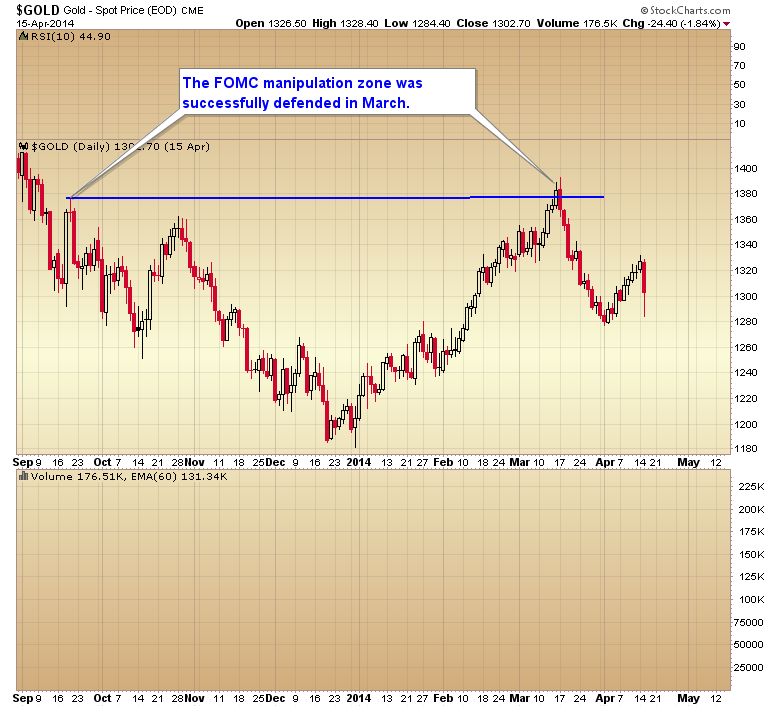
MANIPULATION IS STILL ALIVE AND WELL IN THE GOLD MARKET
If one looks at a longer term chart of the last two years it’s very clear that gold is being capped at certain levels, and those levels are slowly forcing gold lower and lower. Each one of these manipulation zones are being defended successfully and that has some serious connotations going forward.
This all started right after the announcement of QE3. Gold was driven below $1700 and held below that level for 2 months. This got the ball rolling so to speak, it broke an intermediate cycle and started the bear market. Of course we all remember the call by GS to sell gold short followed by the premarket attack on April 12 that took out the stops below $1520 leading to a waterfall decline. That had to be one of the most blatant cases of manipulation in market history.
Without a doubt gold completed a final ICL (intermediate cycle low) on Apr. 16. The May retest was the beginning of what should have been a recovery from the manipulation and a resumption of the secular trend.
Without a doubt gold completed a final ICL (intermediate cycle low) on Apr. 16. The May retest was the beginning of what should have been a recovery from the manipulation and a resumption of the secular trend.
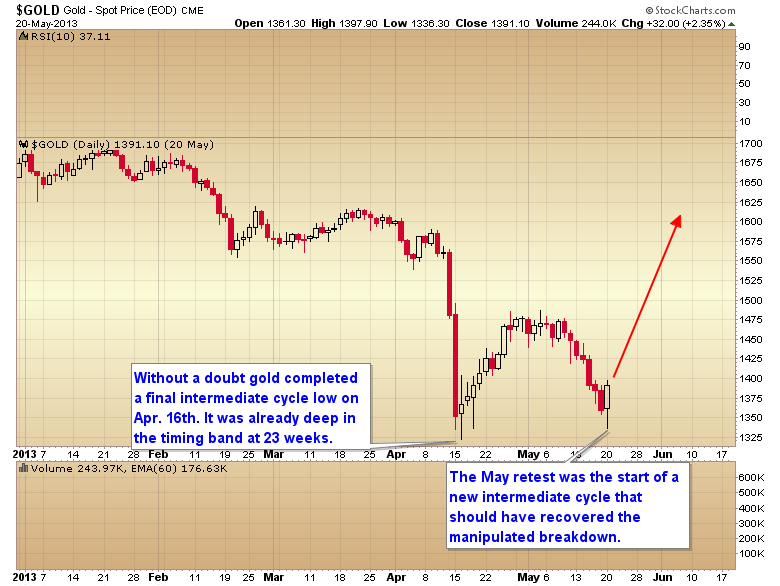
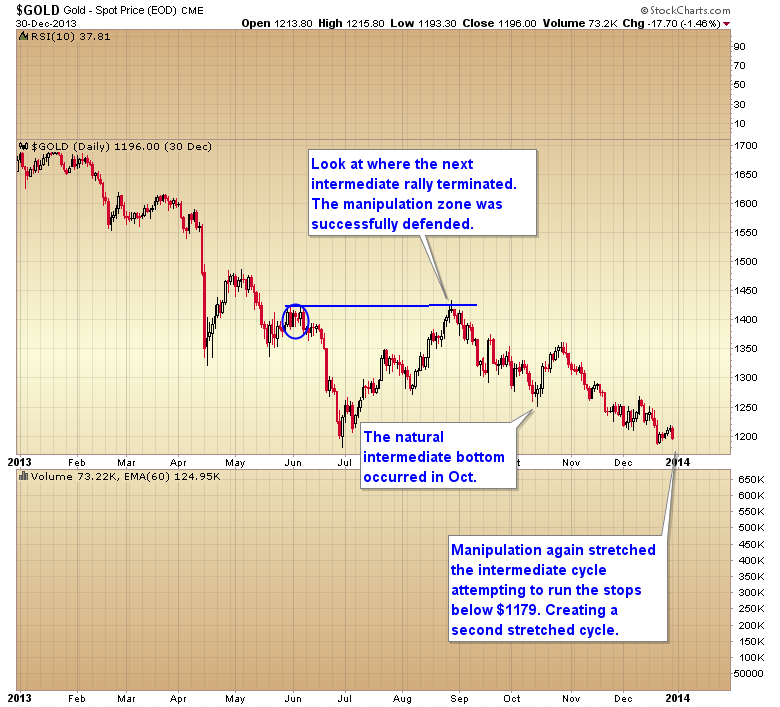
But then something happened. As gold tried to rise above $1400 we saw repeated attacks to keep gold below that level eventually leading to another waterfall decline in June down to $1179. In the process this created a 33 week intermediate cycle - a full 10 weeks longer than normal.
The natural ICL occurred on week 23 at the April bottom. The manipulation to prevent a new intermediate rally above $1400 added a full 10 weeks to the cycle.
And let me say that having observed these cycles for over 10 years I can say without a doubt that a failed intermediate cycle in decline never stretches an extra 10 weeks. Most of the time they bottom a bit prematurely as the selling pressure tends to exhaust itself quickly.
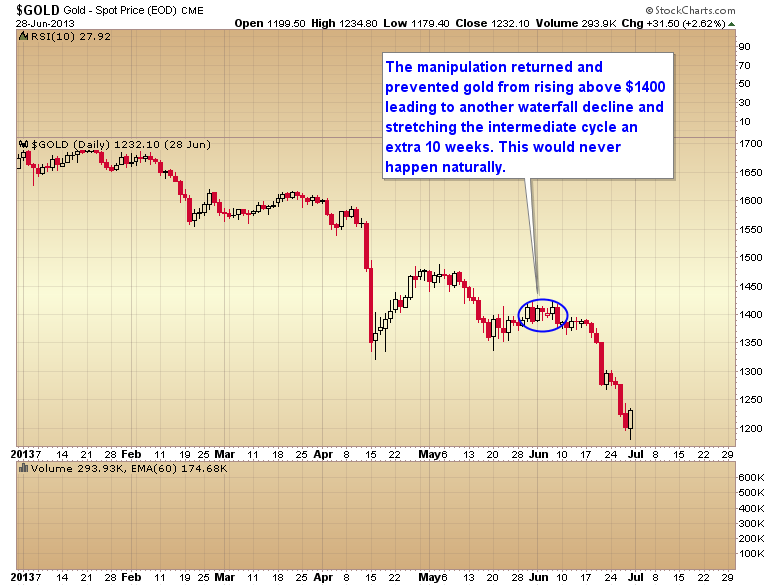
So a manipulation zone had been established between $1400 and $1430. The next intermediate rally out of the June bottom was capped right at that $1430 level. The zone had been successfully defended. This then led to another stretched intermediate cycle. Again having watched these cycles for years I can say without a doubt that two stretched and declining cycles in a row isn't a naturally occurring event. The powers that had created this bear market were trying to run the stops below $1179 and in the process they stretched a second intermediate cycle.
The next blatant manipulation of the gold market occurred right after the September FOMC meeting. Gold was immediately taken down the very next day creating a daily cycle that topped on day 1. Never in history has a gold daily cycled topped on day 1.
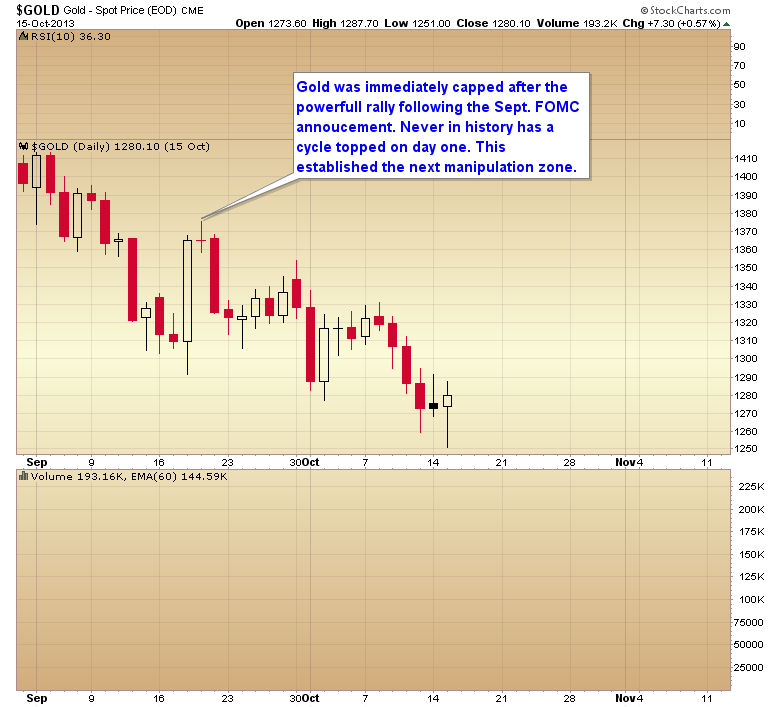
This established another manipulation zone at $1375. The intermediate rally out of the Dec. 31 bottom poked above that $1375 level for 1 day before it was turned back down. Another manipulation level was being successfully defended.
We now we have another manipulation zone that has formed at the top of the recognition day on June 19 at $1320. Other than just a few days above that level the zone has been defended and it has now broken the intermediate cycle.
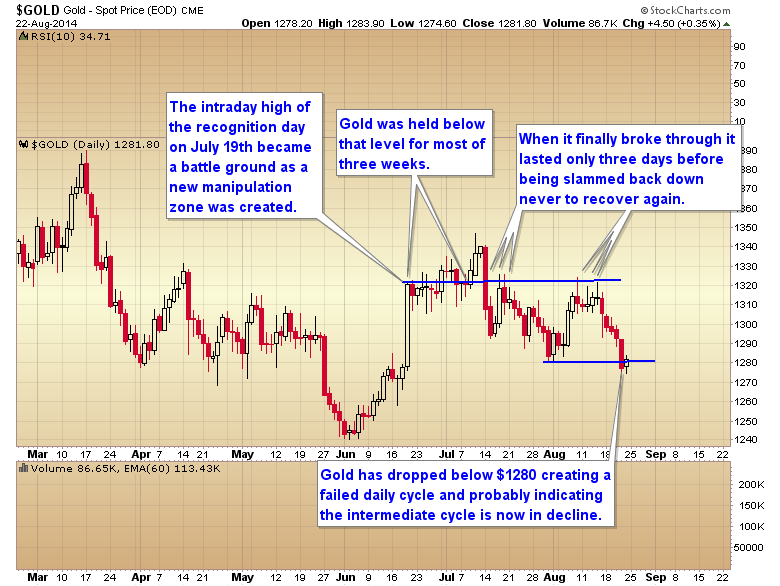
What is concerning is that every one of these manipulation zones are being successfully defended when challenged. That would suggest that the next intermediate rally is unlikely to get above $1320 for more than a day or two before it too is turned back.
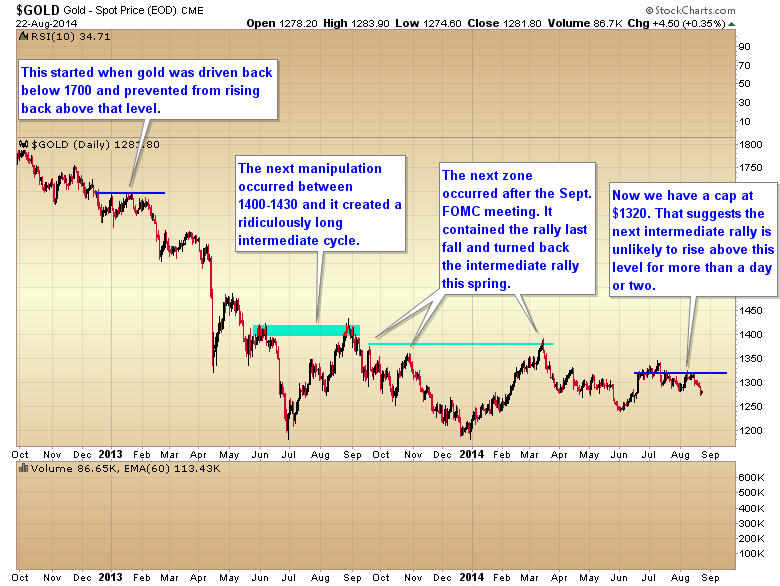 At this point it has become painfully obvious that once a manipulation zone is established the powers in the paper market can defended them, and each one of these zones are occurring at lower and lower levels.
I think traders need to recognize this fact and adjust their trading accordingly. One can only go long the sector at an intermediate cycle bottom, and once that rally approaches a manipulation zone get out and stay out until the next intermediate bottom. As this pertains to the gold market right now it would suggest that we aren't likely to see $1320 recovered quickly.
I honestly don’t know what it is going to take to break this pattern in the gold market. If two ongoing wars isn't enough to drive gold through the $1320 suppression zone who knows what kind of black swan event will have to occur to trigger a resumption of the secular trend.
For now I have locked up our gains in the metals and I'm going to continue to sit on the sidelines until gold gets into the timing band for the next intermediate bottom, and that isn’t due for another 7-12 weeks.
If we see a manipulation zone challenged and broken, that will be our clue that gold is ready to trade freely again. As of right now that would mean a sustained move above $1320. If that were to occur that would get me off the couch and back into the market. If not, then I will wait patiently for the next buying opportunity in 2-3 months.
So far the SMT has made good money buying these intermediate bottoms and exiting when gold pushes into a manipulation zone. But until the manipulation has been broken, a buy and hold strategy is no longer an option as each one of these zones is occurring at lower and lower levels as the powers in the paper market try to keep the bear market alive.
So far the SMT has made good money buying these intermediate bottoms and exiting when gold pushes into a manipulation zone. But until the manipulation has been broken, a buy and hold strategy is no longer an option as each one of these zones is occurring at lower and lower levels as the powers in the paper market try to keep the bear market alive.
Monday, August 18, 2014

Sunday, August 17, 2014


Wednesday, August 13, 2014

Saturday, August 9, 2014
ARE STOCKS FINALLY STARTING THE TOPPING PROCESS?
With all the uncertainty in the world, and everything that could happen over the weekend, I think it’s safe to say that the market didn't rally 22 points naturally to complete a swing low as we go into the weekend. When I saw the index futures turn from deeply oversold to positive as if by magic in the pre-market Friday morning I had a pretty good idea that the Fed was ready to put an end to this correction. By the end of the day it looks like they probably succeeded (at least for now).
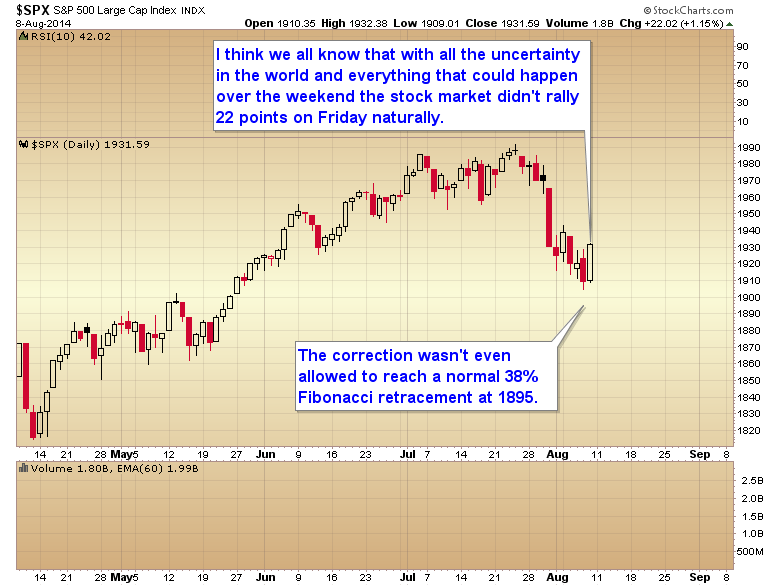
Now the question becomes, since the Fed didn't allow even a 38% retracement is this just a daily cycle low, or was that all we are going to get for an intermediate degree correction? Looking at the McClellan Oscillator this kind of powerful surge is usually indicative of an intermediate degree bottom. However, I’m not sure that’s going to be the case here.
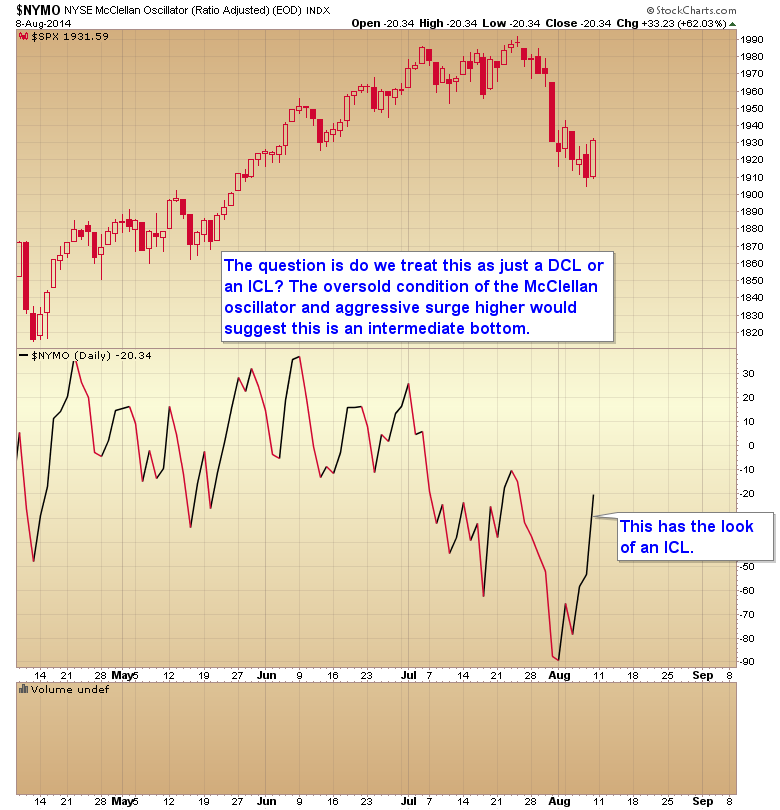
If we consider that this correction was terminated prematurely then I suspect we are going to have to retest these lows in the coming weeks so what I think is likely to play out is a move back up to and maybe marginally above 2000, followed by another move down that at least retraces 38% of this intermediate rally. In other words I’m looking for a short daily cycle that makes a slightly higher high and then a marginally lower low.
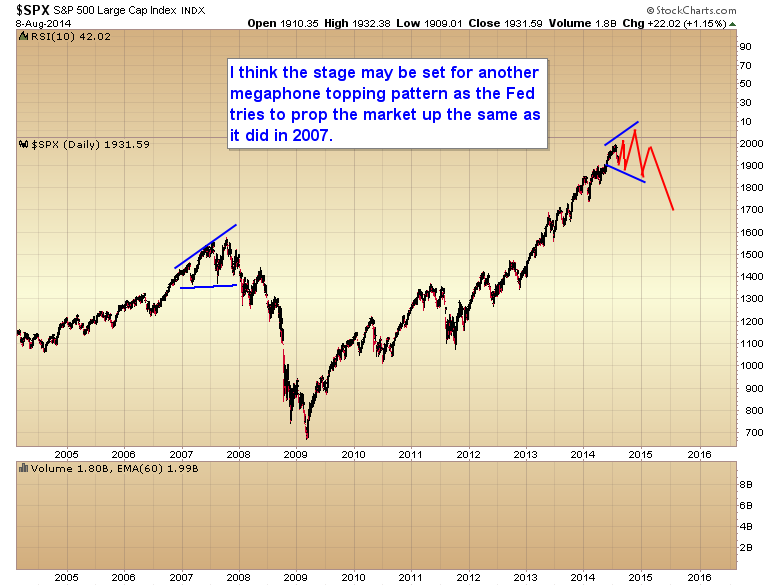
That should set the market up for the Fed to ram it back up ahead of the September FOMC meeting and probably through most of October ahead of the midterm elections. As a matter of fact we may be looking at a potential megaphone topping pattern in the months ahead.
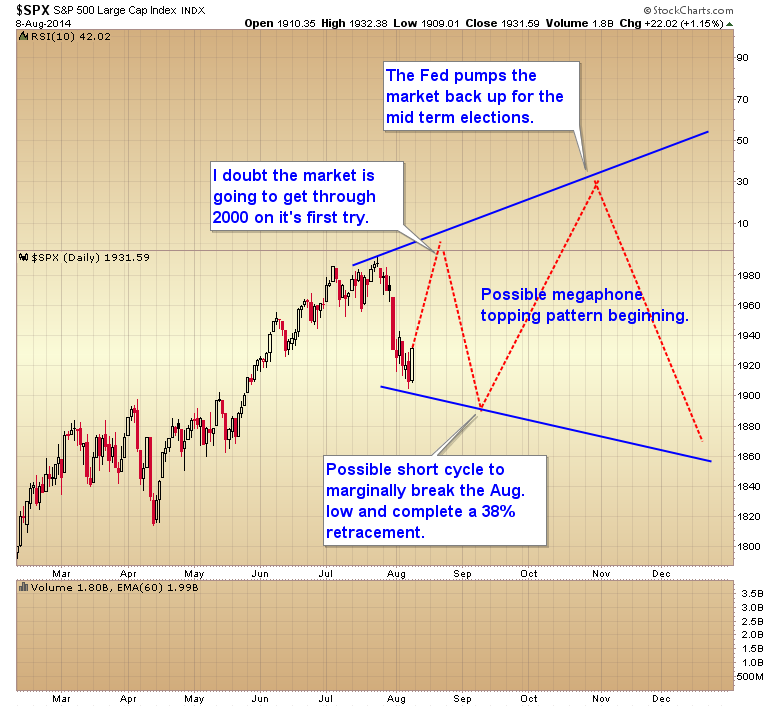
This was how the last bull market topped also, as the Fed tried to artificially prop the market up with zero interest rates and trashing the dollar.
Unless we get a miraculous reversal on Monday that does test that 38% retracement, I suspect the stock market has a date with the 2000 level pretty quickly. I don't think the S&P is likely to get through that level though, at least not on its first try. 2000 is too big of a psychological level to be easily overcome.
Tuesday, August 5, 2014

Friday, August 1, 2014

Thursday, July 31, 2014

Wednesday, July 30, 2014
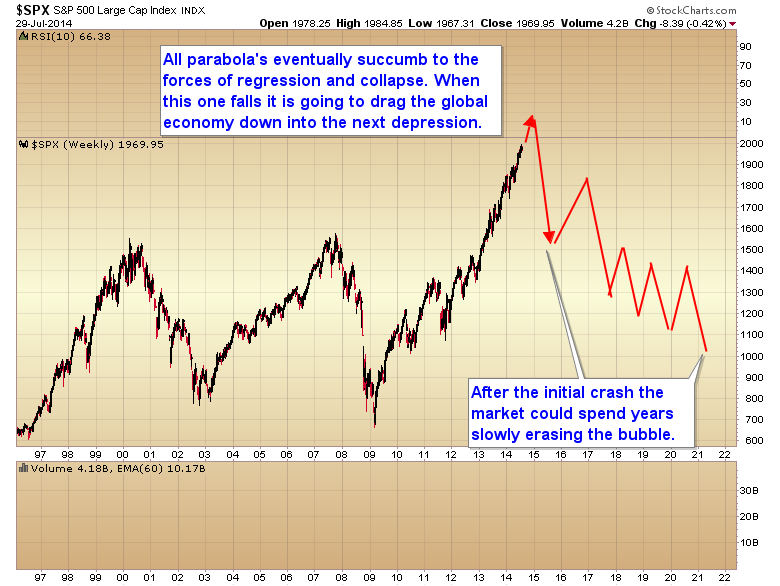
SOWING THE SEEDS OF THE NEXT DEPRESSION
In their infinity wisdom the Fed thinks they have rescued the economy by inflating asset prices and creating a so called "wealth affect". In reality they have created the conditions for the next Great Depression.
Over the last two years the Fed has increasingly intervened in the market to prevent normal corrective moves. As you can see in the chart below this has allowed the stock market to transition from what could've been a normal bull market into a gigantic parabolic bubble.
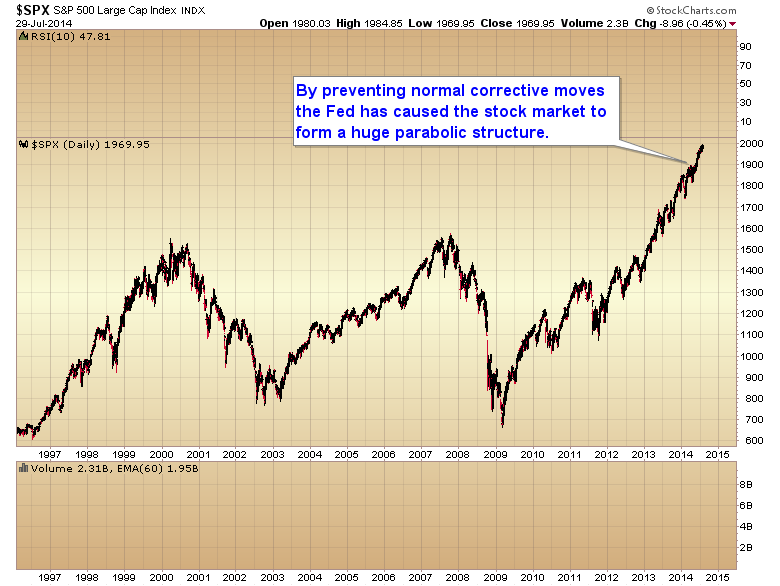
Now it's just a matter of time as to when the forces of regression collapse this parabolic structure. When they do it will drag the global economy into the next depression.
This is the same process that happened in 1929. The Fed with their easy monetary policy in the 1920s allowed stocks to generate a huge parabolic move exactly the same as what is happening today. In October 1929 the forces of regression finally clamped down and collapsed the parabola. This wasn't the stock market predicting the depression. The depression was caused by the collapse of the stock market which had simply succumbed to the forces of regression.
The same thing is going to happen to our stock market today. While no one can predict when the exact top will occur, I can predict with 100% accuracy that at some point this parabolic structure is going to collapse. And when it does it will push the global economy into the next great depression exactly as the stock market collapse in 1929 caused the first Great Depression
.
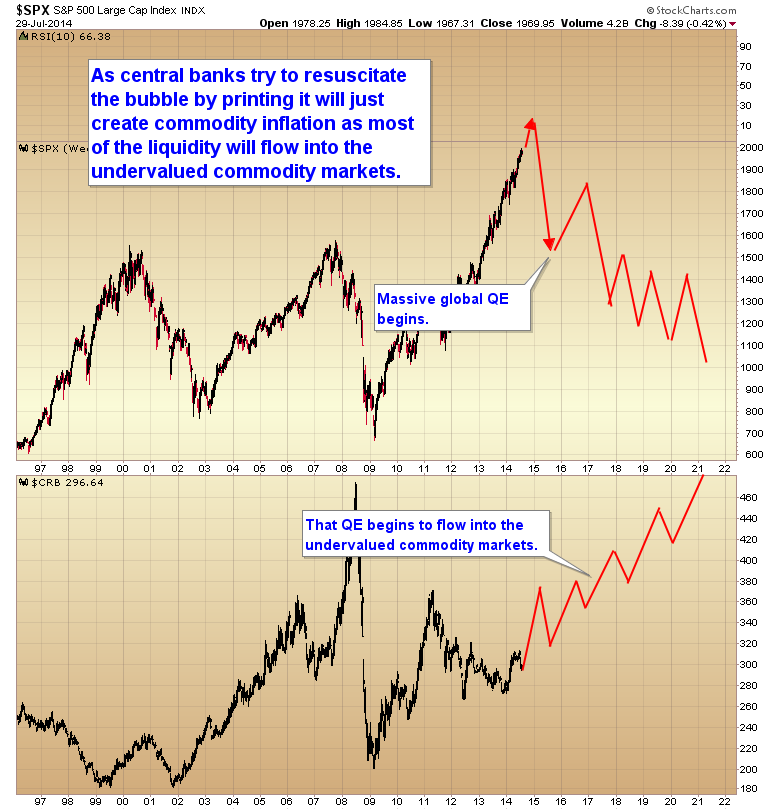
I expect central banks worldwide will exacerbate the problem after the initial crash by printing staggering amounts of money trying to rescue the broken stock market. This will have the effect of extending and prolonging the downturn for many years, and in the process should drive inflation into the commodity markets.
Sunday, July 27, 2014

Thursday, July 24, 2014

Wednesday, July 23, 2014


Thursday, July 17, 2014

Wednesday, July 16, 2014

Tuesday, July 15, 2014

Sunday, July 13, 2014


Friday, July 11, 2014

Wednesday, July 9, 2014


Subscribe to:
Posts (Atom)